
Time vs Frequency Domains
Time domain is a term used in signal processing and electromagnetic theory. It refers to understanding how a signal varies over time. Time domain analysis is used to examine the behavior and characteristics of a signal over time.
The representation of a signal in the time domain is usually shown by plotting the signal’s amplitude (or another characteristic) against time on a graph. This is used to visualize how the signal changes over time. For example, a graph showing the variation of a sound wave over time or how an electrical signal fluctuates with time is an example of time domain analysis.
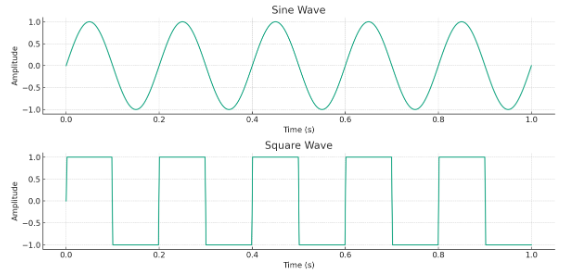
To understand the representation of a signal in the time domain, I can go through some basic graphical examples. Let’s consider two common types of signals: a sine wave and a square wave. I will draw graphs to show how these two types of signals are represented in the time domain:
Sine Wave: A sine wave has a continuous and regular waveform. In the time domain, this waveform is seen as a smooth curve oscillating with a certain frequency and amplitude.
Square Wave: A square wave has a waveform that changes instantaneously between maximum and minimum values, characterized by sharp transitions. In the time domain, these sharp transitions are represented with right-angled corners.
Now, I will draw graphs to represent these two types of signals in the time domain.
-
Sine Wave Graph: This graph shows the sine wave, characterized by its smooth and continuous oscillations. The sine wave oscillates with a specific frequency and amplitude over time.
-
Square Wave Graph: This graph depicts the square wave, characterized by its sharp transitions and right-angled corners. The square wave alternates rapidly between its maximum and minimum values
These graphs provide a visual representation of how these two types of signals appear in the time domain, illustrating key characteristics of each waveform.
The frequency domain is a concept that shows how a signal or waveform is distributed according to its frequency components. Converting a signal from the time domain to the frequency domain reveals the different frequencies contained within the signal and their magnitudes (amplitudes). This analysis is crucial for understanding the characteristics of signals and is used in fields such as music, communications, and signal processing.
In the frequency domain, signals are typically represented as a spectrum graph. This graph demonstrates how much energy or power the signal contains at various frequencies.
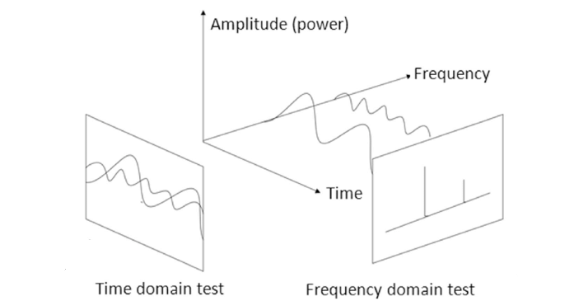
Representations in the time domain show the instantaneous values, periodic characteristics, sudden changes and general waveform of the signal. This type of analysis is an essential tool for understanding the dynamics and characteristics of the signal over time.